Product tour

PCB debugging on a real bench

Seven screenshots of the application as it runs — not mockups, not renders. Each is labelled with where it lives in the app and, where a capture is involved, whether the scope behind it was a real instrument or the built-in simulator. Click any image to read it at full size.

Guided session Simulator mode

The board, the capture and the verdict in one window

Left: every net in the board graph, coloured by what YProbe knows about it. Centre: the capture. Right: each parameter judged against the expected signal, a signal-health score, and the ranked fault hypotheses. The strip under the toolbar is the assistant's next move — “Probe c:EN/sync_5V4 next (4 still open).”

The dialog is YProbe arguing with the expectation rather than the board: 2 MHz was asked of a node whose RC corner sits near 25 kHz (≈ 102 kΩ source, ~62 pF of probe and load). A clean square is not physically realizable there, so a low-amplitude capture is physics — not a defect — and you get told before it becomes a false FAIL.

And that warning is completely deterministic. Nothing was asked of a model: the source impedance comes out of the resistor network in your netlist, the capacitance is the probe and load, and the corner is arithmetic. Same board, same expectation, same answer, every single time.

  • Nets colour-coded by state — the tree footer reads 2254 nets · 1 bad · 3 suspicious
  • Every parameter judged on its own: DC voltage, Vmax, Vmin — expected against measured
  • Hypotheses re-ranked after each measurement — top one here at 44 %
  • Scope, channel, V/div, time-base and trigger driven from the same toolbar
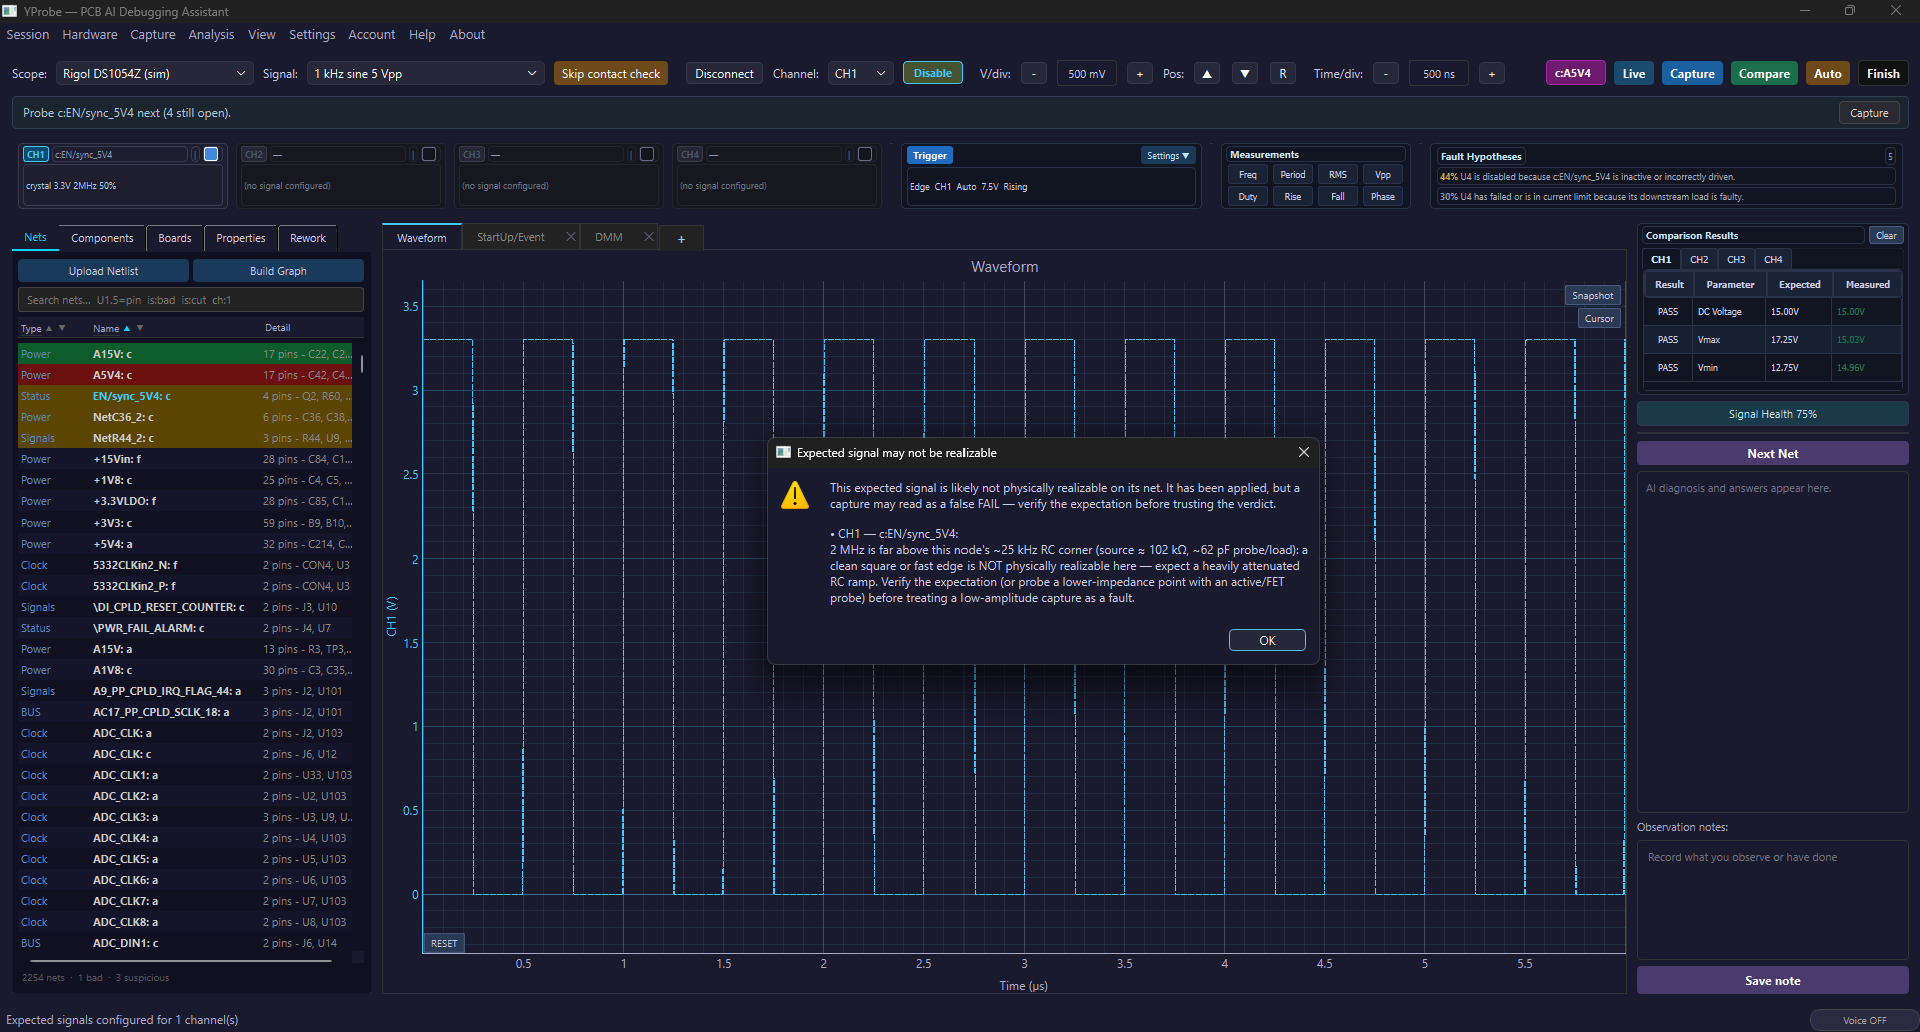
The YProbe main window: a colour-coded net tree on the left, a square-wave capture in the centre, comparison results with three PASS rows and ranked fault hypotheses on the right, and a dialog warning that the expected 2 MHz signal is not physically realizable on this node.
A session on the simulated scope — the instrument combo reads Rigol DS1054Z (sim). The identical workflow runs against a real instrument over VISA.

That check is one of a family. Before any capture is judged, YProbe runs every physical-feasibility objection it can derive from your netlist's own topology — resistor networks, filters, dividers, pull-ups, reset and crystal networks, op-amp stages, series rectifiers, AC coupling. Each is computed, not inferred:

  • Frequency vs filter passband
  • Frequency vs source-impedance RC corner
  • Rise time vs the 2.2·R·C floor
  • Power-on rise vs a reset RC network
  • Level vs the divider-tap ceiling
  • PWM averaged into DC by a low-pass
  • Slew vs the rail's bulk capacitance
  • Swing beyond an op-amp's own rails
  • Level no rail on the board can produce
  • Bipolar swing past a series rectifier
  • Static level vs a resistor's power rating
  • Open-drain high with nothing to pull it up
  • Logic high below the receiver's VIH
  • Level above an IC's ESD-clamp ceiling
  • Idle level inverted by a switch stage
  • Two push-pull outputs wired together
  • DC held on an AC-coupled node

The same holds for most of what this page shows: the PASS/FAIL comparison, the probe-contact classifier, the protocol decode, the startup rise/overshoot/settle limits, the monitor's threshold crossings, the aliasing cross-check against the scope's own frequency reading — all of it is arithmetic over samples, topology and instrument readings. The AI proposes and ranks explanations; it never gets to decide what the board did.
Reasoning Analysis ▸ Fault hypotheses

Every conjecture on the record — and you can veto it

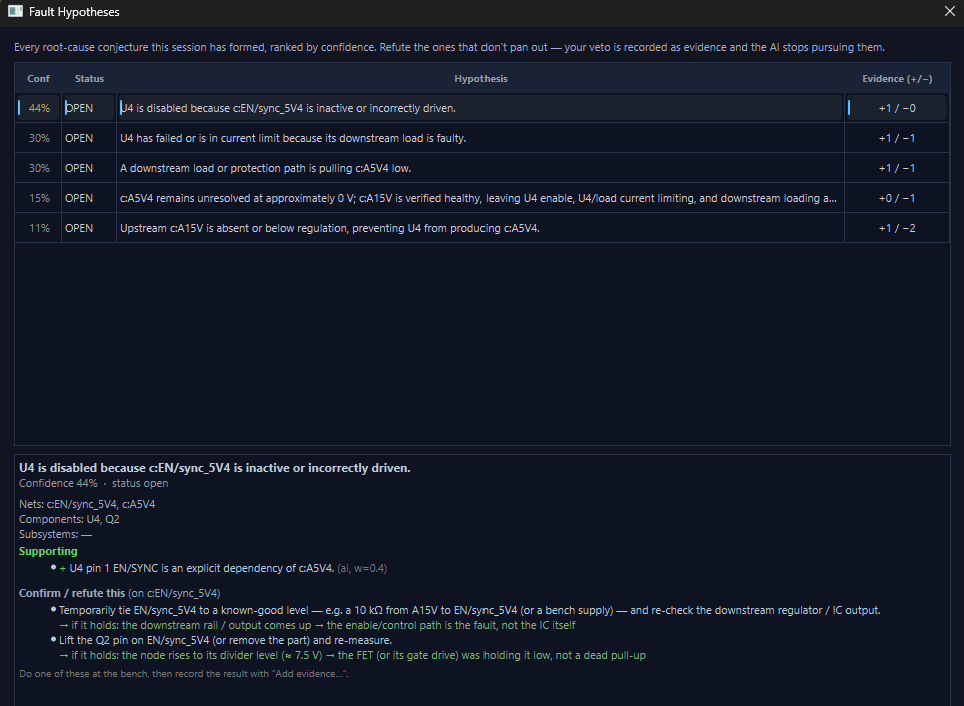
Each root-cause conjecture the session has formed, ranked by confidence, with the evidence tally that got it there and the nets and components it implicates. Nothing is a black box you have to take on faith.

Select one and it tells you how to settle it at the bench: tie EN/sync_5V4 to a known-good level through 10 kΩ, or lift the Q2 pin — each with what the outcome would mean. Record the result and the ranking moves. Refuting is a first-class action: your veto is stored as evidence and the AI stops pursuing that branch.

  • Confidence, status and a signed evidence count (+1 / −2) per hypothesis
  • Supporting evidence is attributed and weighted — (ai, w=0.4)
  • Confirm/refute experiments, with the expected outcome of each spelled out
  • Your bench result goes back in through “Add evidence…” and re-ranks the list
The Fault Hypotheses window listing five open conjectures ranked from 44 percent to 11 percent confidence, with an evidence tally per row and a detail pane showing supporting evidence and two bench experiments to confirm or refute the top hypothesis.
Five competing explanations for one dead rail, each with the experiment that would kill it.
Probe contact Real hardware · Rigol over USB

A bad probe touch is never a board failure

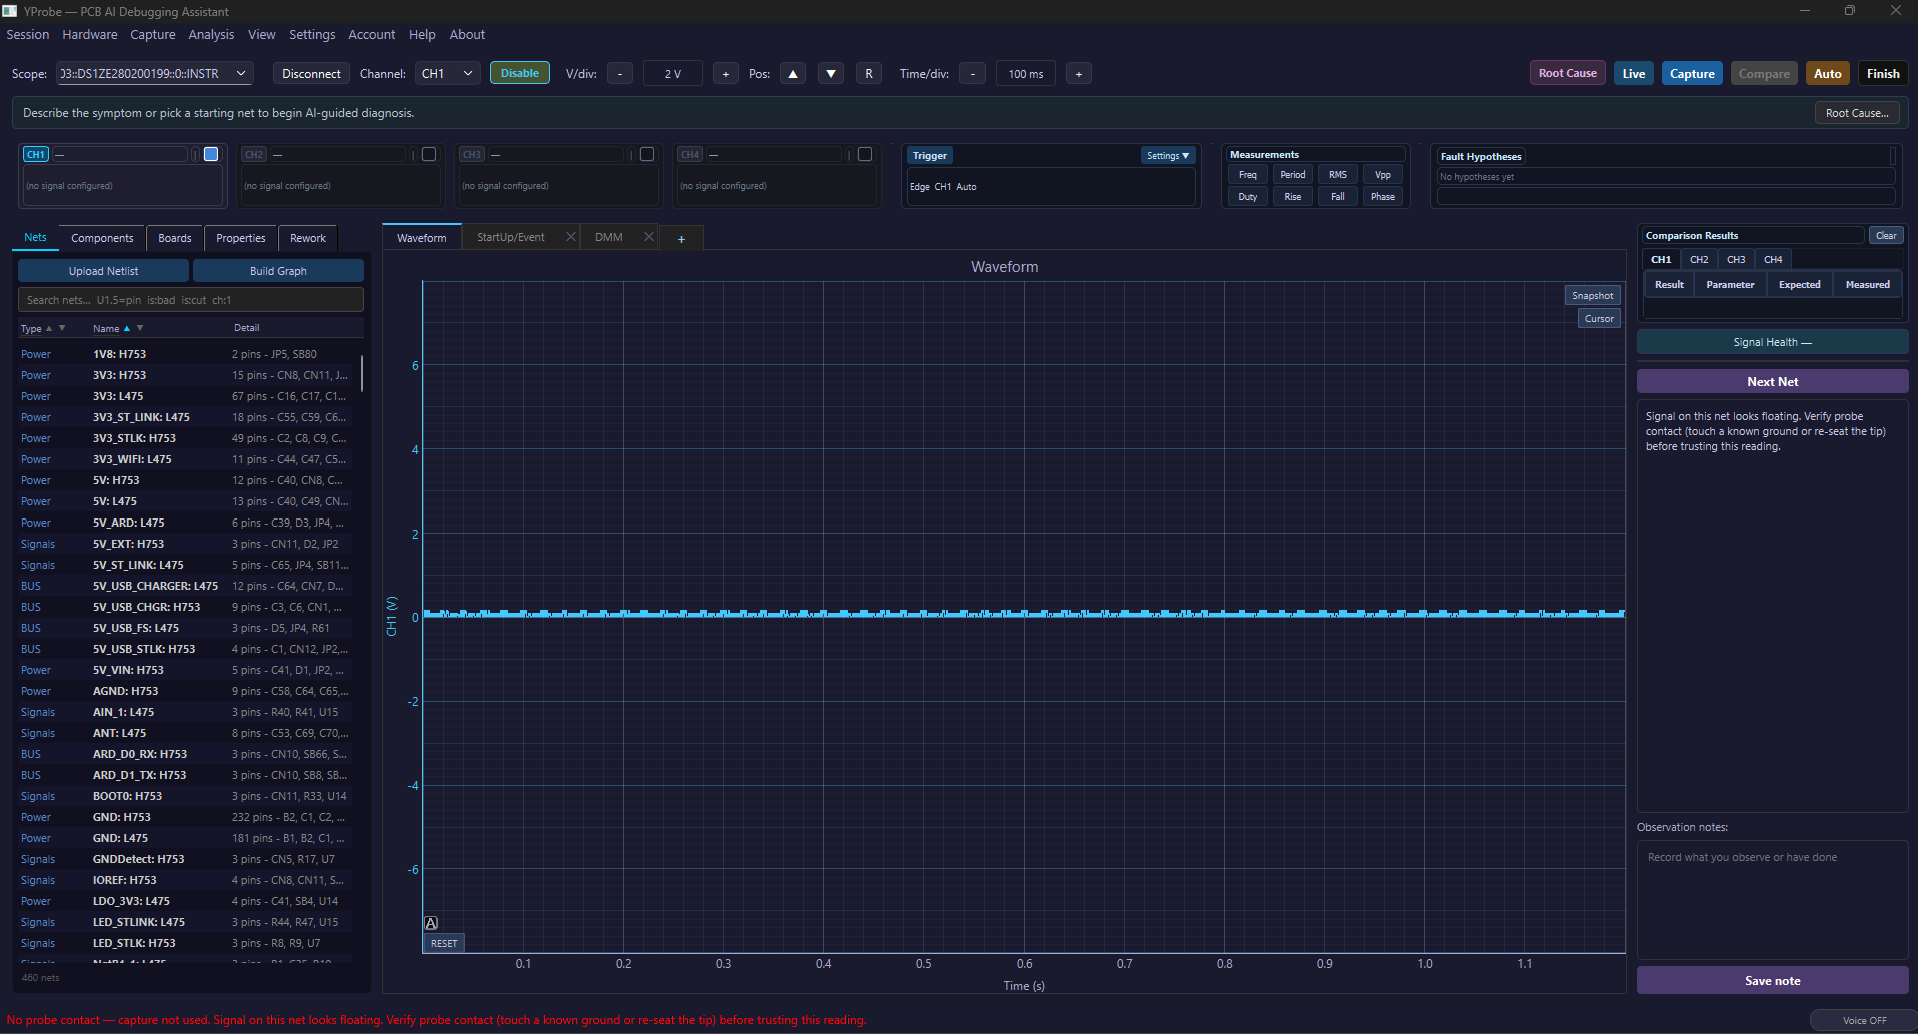
This capture never became a verdict. The classifier called the trace floating, the status bar says so in red — “No probe contact — capture not used” — and the capture was dropped: no PASS/FAIL, nothing written to the session record, nothing handed to the AI as board evidence.

That is the difference between a tool that measures and a tool you can trust with a diagnosis. A slipped tip that reads 0 V looks exactly like a dead rail, and it will cost you an afternoon.

  • Each capture classified: contacted, floating, intermittent, clipped or unknown
  • Consecutive cross-capture agreement required before a state locks
  • Floating or intermittent at confidence ≥ 0.65 blocks the verdict entirely
  • “Measurement artifact” competes as a hypothesis in its own right
  • Two boards' netlists loaded at once here — 460 nets, suffixed H753 and L475
The YProbe main window connected to a real Rigol scope over USB. A flat noisy trace sits at zero volts, the right-hand panel advises verifying probe contact, signal health shows a dash, and the status bar states in red that there was no probe contact and the capture was not used.
A real instrument — the toolbar carries the VISA resource string, not a simulator label.
Protocol decode Logic view

Bus traffic decoded straight from the analog capture

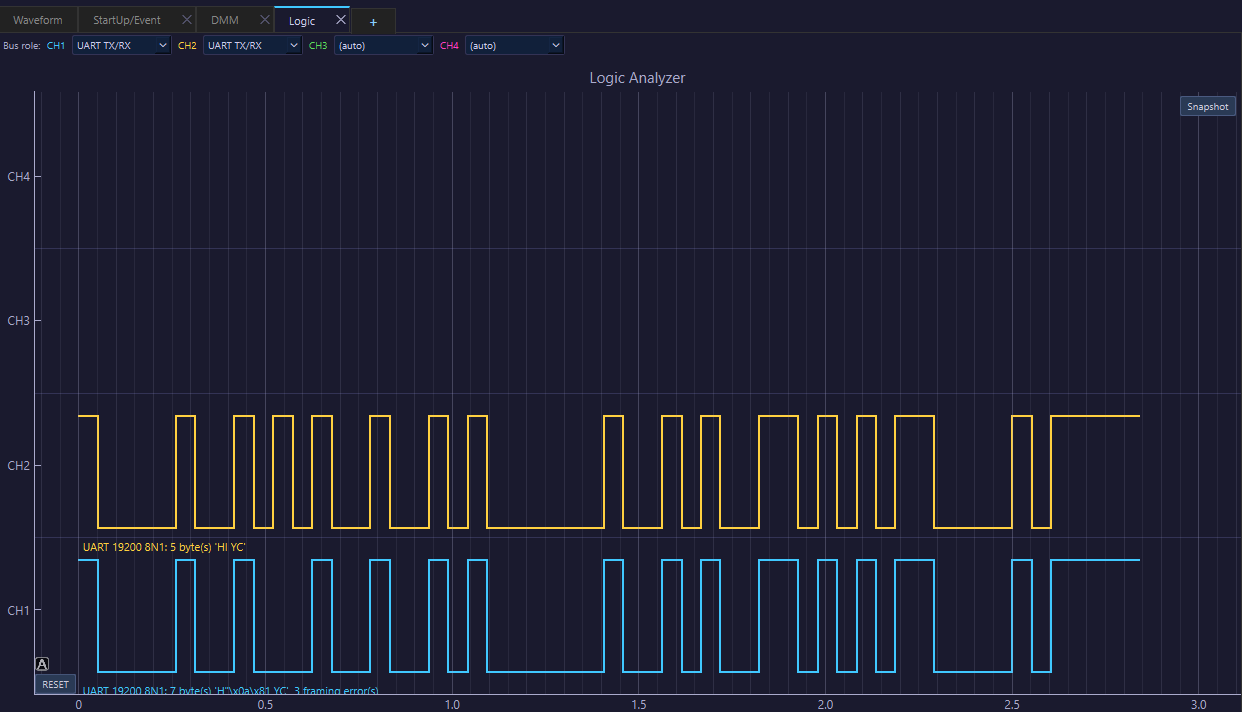
No separate logic analyser, no second instrument. The Logic tab takes the captures you already have and decodes them — here two channels of UART at 19200 8N1, annotated with the bytes that came out.

And it reports what actually happened rather than what you hoped for: the lower trace decodes to seven bytes with three framing errors. Decoded traffic feeds the diagnosis, so a NACKing sensor or a garbled frame is evidence, not just pixels on a screen.

  • UART with auto-baud, I²C with address / R-W / ACK-NACK, and SPI
  • Channel roles inferred from your net names — SDA/SCL, MOSI/SCK/CS, TX/RX
  • Decode summaries reach the AI prompt with the rest of the evidence
  • Needs at least four samples per bit — and says so instead of guessing
The Logic analyser tab showing two digital traces, CH1 in blue and CH2 in orange, with per-channel bus-role selectors set to UART TX/RX and decode annotations reading 19200 8N1 with byte contents, one of them reporting three framing errors.
Two analog channels in, decoded bytes and framing errors out.
Short hunt Analysis ▸ Short Hunt…

Follow the milliohms down to the shorted pad

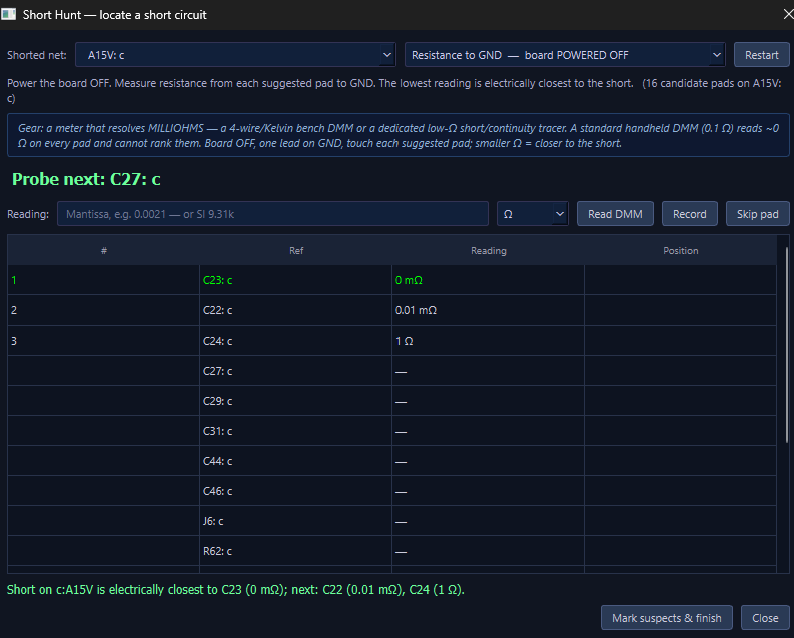
A dead short lives on a pad, not on a net. Short Hunt lists the candidate pads on the shorted net — sixteen here — walks you through them one at a time, and ranks every reading you take: the lowest one is electrically closest to the short.

Read the blue box. It tells you plainly that a 0.1 Ω handheld meter reads ~0 Ω on every pad and cannot rank them, and that you need a 4-wire bench DMM or a low-Ω tracer. You open this tool yourself from the Analysis menu — the assistant never sends you here, because most benches don't have the meter it needs.

  • Candidate pads come from the board graph, not from you typing them out
  • Resistance-to-ground with the board off, or a millivolt gradient with it powered
  • Readings taken from a connected DMM or typed in; the ranking updates live
  • Finishing marks the top suspects SUSPICIOUS, the net BAD, and records the summary
The Short Hunt dialog: a shorted-net selector, a resistance-to-ground mode with the board powered off, a note about needing a milliohm-resolving meter, a next-pad prompt, and a table ranking measured pads from 0 milliohms upward.
Three pads measured, thirteen to go — and the running conclusion at the bottom.
Simulator lab Hardware ▸ Simulator Lab…

Build the signal you want to test against

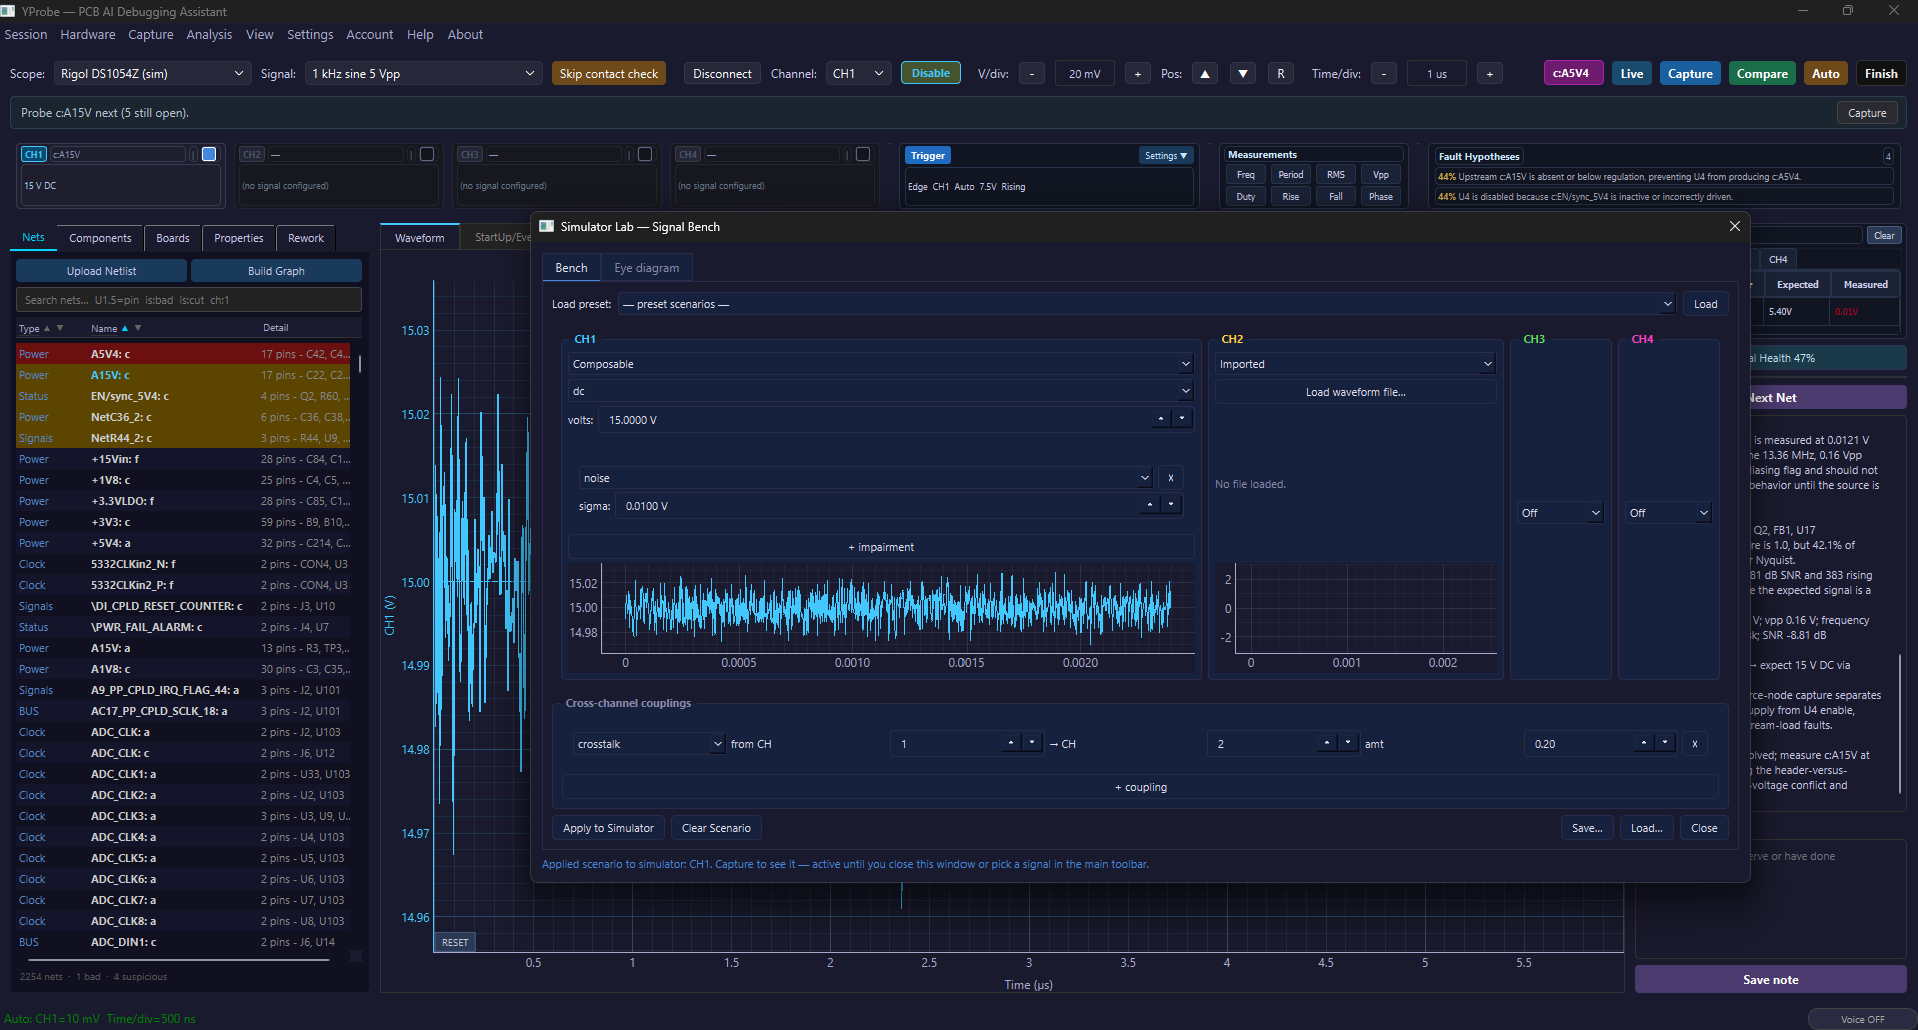
Pick a base waveform, stack impairments on top of it, couple the channels together, and push the scenario at the simulated scope. Here CH1 is a 15 V rail carrying 10 mV of noise, CH2 is set to play back a waveform file exported from another instrument, and 20 % of CH1 crosstalks into CH2.

This is why you can evaluate YProbe with nothing on the desk. The entire workflow — capture, judge, decode, monitor, diagnose — runs against generated signals, including faults that only misbehave once every few minutes.

  • Bases: DC, sine, square, PWM, triangle, sawtooth, ramp, PRBS
  • Impairments: noise, bandwidth limit, resonance, jitter, clipping, quantisation, ripple
  • Cross-channel couplings — crosstalk and shared-rail droop between channels
  • Live eye-diagram tab; scenarios save and load as JSON
  • Or import a real capture from a CSV/TXT export and play it back
The Simulator Lab signal bench dialog over the main window: per-channel editors with a composable DC base plus a noise impairment and a live preview plot, an imported-waveform channel, and a cross-channel crosstalk coupling from channel one into channel two.
Signals are configuration, not canned clips — every layer is editable and previewed as you build it.
Remote debugging Free technician client

Exactly what your contract manufacturer sees

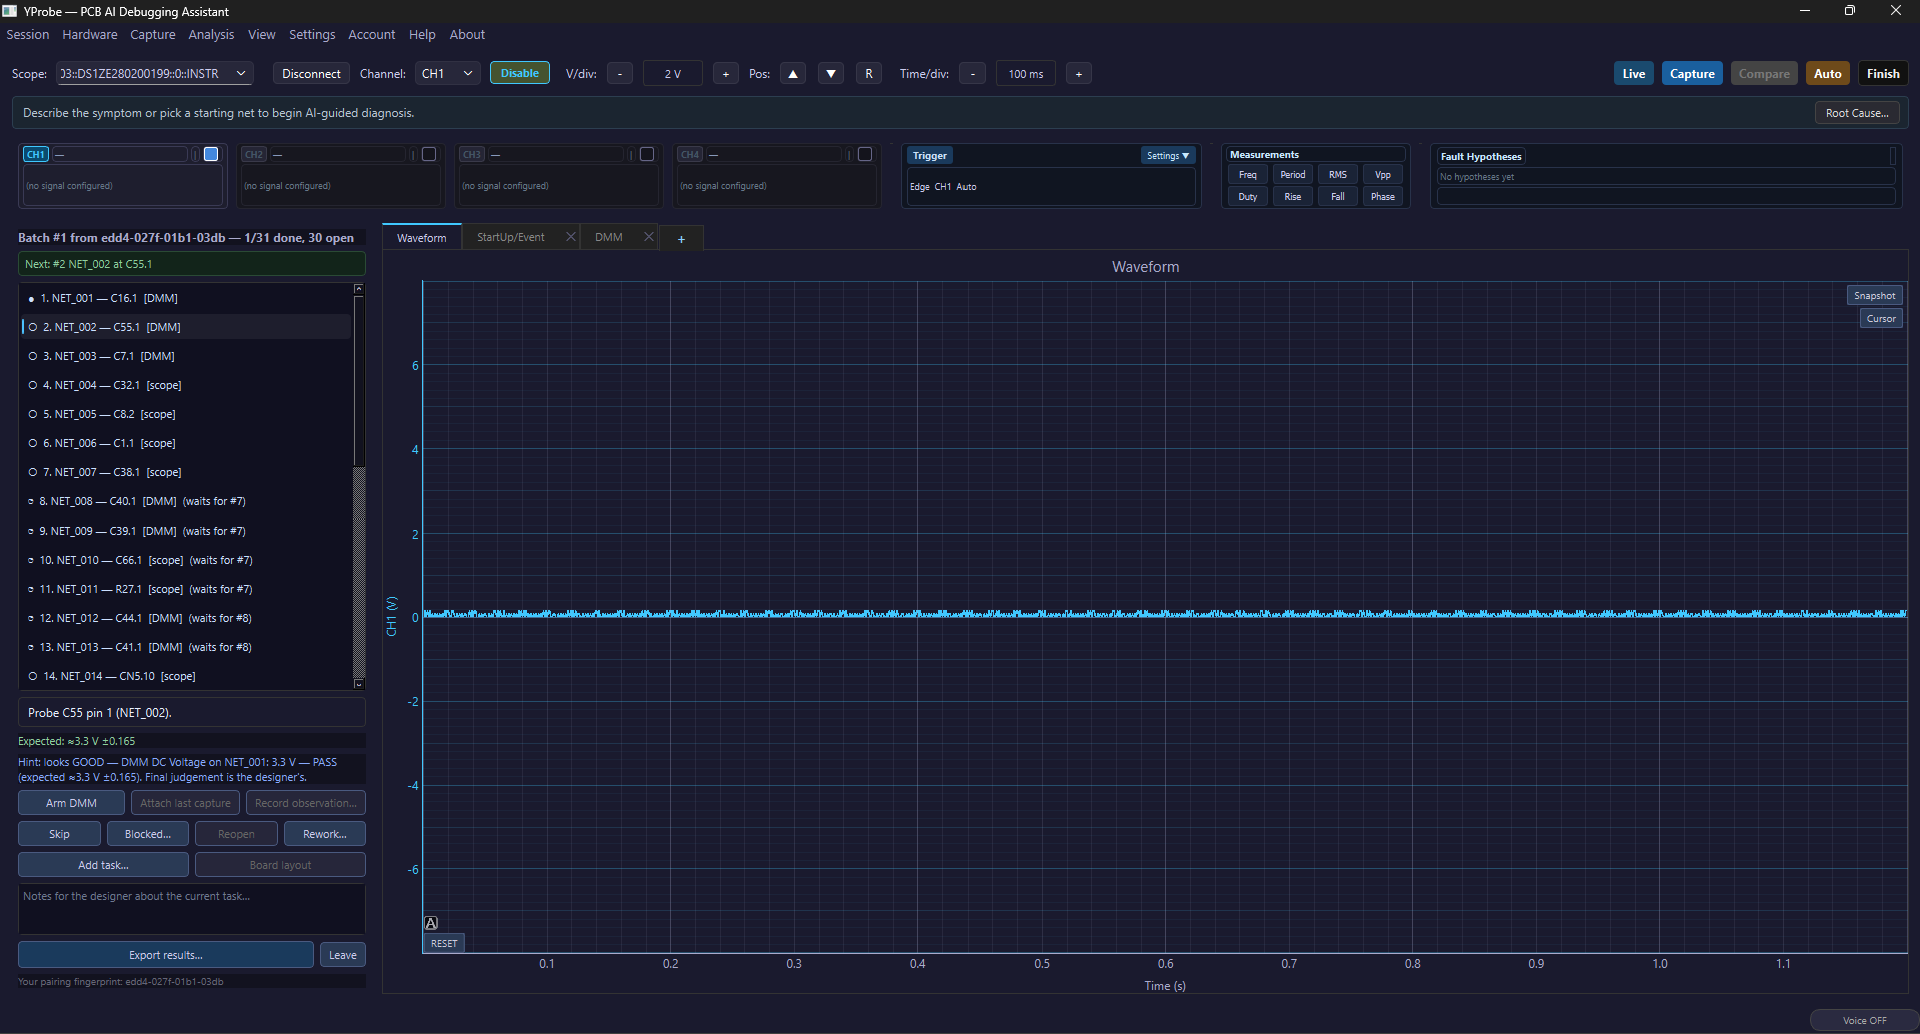
A signed task package, opened in the free technician client. Probe points, expectations, and a local hint — and nothing else. The nets are aliases: NET_001, NET_002. Your netlist, your BOM and the AI's reasoning are not hidden in this package; they were never written into it.

The client can hint but never decide — “Final judgement is the designer's”. Results come back signed and replay-protected, and the verdict is recomputed on your machine from the raw samples before it counts.

  • Batch progress up top, pairing fingerprint at the bottom — 1 of 31 done here
  • Contingent tasks: #8 and #9 stay parked until #7 is answered
  • Arm the DMM, attach a capture, record an observation, mark blocked, log rework
  • Technicians can add tasks of their own; you resolve the real net at review
  • No AI calls and no session state on the technician's side — by construction
The technician client showing a task batch from a pairing fingerprint with 1 of 31 tasks done, a numbered queue of aliased nets with measurement methods and dependencies, the current probe instruction with its expected value, a local hint, and buttons to arm the DMM, skip, mark blocked, log rework and export results.
The panels that carry board context and AI reasoning are gone — the technician side of YProbe simply has no place to put them.

Want it on your bench?

Tell us what you debug and we'll send you YProbe when your wave opens. Engineers with a board on the bench right now go to the front of the queue.

Request early beta access